NVMI KPIs help manufacturers determine whether intelligent inventory management is actually improving material availability, inventory efficiency, and supplier replenishment performance. Installing smart cabinets or collecting real-time inventory data is only the beginning. Procurement managers, supply chain teams, warehouse managers, and plant leaders also need a consistent way to measure whether stock is moving at an appropriate rate, whether shortages are occurring, whether required materials are available when needed, and whether suppliers respond to replenishment signals as expected.
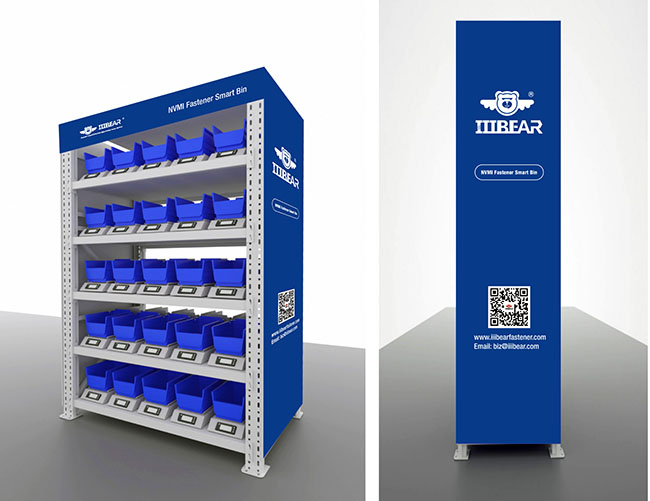
The most useful KPI framework does not focus on one number. Inventory turns can improve while stockouts become worse. Service level can increase because the plant is holding excessive inventory. A supplier can respond quickly to shortage signals while inaccurate material records continue to create unnecessary replenishment. A strong NVMI measurement system therefore combines inventory, availability, replenishment, and data-quality indicators.
NVMI KPIs for Measuring Inventory and Replenishment Performance
Quick Answer
A practical NVMI KPI dashboard should track at least four dimensions: inventory efficiency, material availability, supplier replenishment performance, and data reliability. Common measures include inventory turns, stockout rate, service level, and one or more replenishment KPI measures such as signal-to-response time or replenishment completion time.
These metrics should be defined before the pilot begins. The buyer and supplier need to agree on the measurement period, data source, numerator, denominator, location scope, and treatment of exceptions. KPI targets should be based on the manufacturer's baseline and operational requirements rather than presented as universal NVMI performance guarantees.
Key Takeaways
-
Do not evaluate NVMI with inventory value alone.
-
Inventory turns indicate how efficiently stock supports actual material usage.
-
Stockout rate should use a clearly defined event, SKU, location, or demand denominator.
-
Service level must be defined precisely because different service-level methods measure different outcomes.
-
Supplier replenishment should be measured from signal generation through response and refill completion.
-
Real-time inventory data makes KPI measurement more actionable by reducing the delay between physical material movement and reporting.
-
High service levels achieved only by carrying excessive inventory should not automatically be treated as successful inventory optimization.
-
NVMI performance should be reviewed as a balanced set of availability, inventory, replenishment, and data-quality indicators.
Table of Contents
-
Build a balanced NVMI KPI framework
-
Measure inventory turns
-
Define stockout rate correctly
-
Measure service level
-
Track replenishment performance
-
Add data-quality KPIs
-
Segment KPIs by SKU and location
-
Use NVMI data for continuous improvement
-
Build a practical KPI dashboard
-
Implementation checklist
-
Frequently asked questions
How to Define NVMI KPIs Before Measuring Performance
The first step is to define what success means for the material-management process. A plant introducing intelligent inventory control may be trying to improve material availability, reduce repetitive manual counting, gain better visibility into consumption, improve supplier response, reduce unnecessary stock, or achieve several of these objectives at the same time.
Each objective requires a different KPI. If the primary problem is production-line shortages, stockout and service-level indicators deserve close attention. If the problem is excessive inventory, inventory turns and slow-moving material become more important. If the supplier receives shortage information but replenishment remains inconsistent, response-time and completion-time indicators should be added.
Before calculating any metric, document five elements:
-
Definition: What exactly does the KPI measure?
-
Scope: Which SKUs, storage locations, suppliers, or plants are included?
-
Data source: Which system or transaction record provides the data?
-
Time period: Is the KPI measured daily, weekly, monthly, quarterly, or over another period?
-
Owner: Who reviews the KPI and takes action when performance moves outside the accepted range?
This prevents different teams from using the same KPI name while calculating different results.
Inventory Turns: Is Stock Supporting Actual Consumption Efficiently?
Inventory turns show how frequently inventory is consumed and replaced over a defined period. For operational material management, a quantity-based approach can compare total material usage with average inventory.
Inventory Turns = Total Usage During the Period / Average Inventory During the Period
A simple average inventory calculation may use beginning and ending stock:
Average Inventory = (Beginning Inventory + Ending Inventory) / 2
This quantity-based approach is particularly useful when reviewing individual fasteners, C-parts, or other physical materials. Financial teams may use value-based turnover measures instead, so procurement and finance should agree on which version is being reported.
Higher inventory turns can indicate that less average stock is supporting the same level of usage, but higher is not automatically better. If turns increase because the plant has reduced stock too aggressively and materials repeatedly become unavailable, the improvement is not operationally sustainable.
For NVMI analysis, inventory turns should therefore be reviewed together with stockout and service-level performance. A useful question is not simply, "Did turns increase?" It is, "Did inventory become more efficient while maintaining the required material availability?"
Stockout Rate: Measure the Failure the Plant Actually Cares About
Stockout rate appears simple, but manufacturers need to define what counts as a stockout before calculating the KPI.
A stockout can mean different things:
-
A SKU reaches zero inventory at a particular storage location.
-
A user requests material and the required quantity is unavailable.
-
A line-side location cannot satisfy production demand even though stock exists elsewhere in the plant.
-
A supplier misses a replenishment requirement and inventory falls below an accepted operating level.
Each definition produces a different metric. One possible event-based calculation is:
Stockout Rate = Stockout Events / Total Relevant Demand Events
Another plant may track the percentage of active SKUs that experienced at least one stockout during the period. The correct denominator depends on the operational question.
Location also matters. A factory can have sufficient total stock while a production-line cabinet is empty. Plant-level inventory may therefore hide a point-of-use shortage. NVMI dashboards should allow managers to review shortages by material, cabinet, location, supplier, or other relevant dimension.
The purpose of the KPI is not simply to count failures. Repeated stockout events should trigger root-cause analysis. Possible causes include incorrect replenishment settings, increased consumption, delayed supplier response, inventory discrepancies, packaging constraints, or internal material-transfer delays.
Service Level: Define Availability Before Setting the Target
Service level measures the ability of the inventory process to satisfy expected demand, but the term can represent different calculations. The project team should therefore avoid publishing a service-level percentage without explaining what it means.
One method is event-oriented: what percentage of relevant demand periods or requests occurred without a shortage? Another is quantity-oriented: what percentage of required material quantity could be fulfilled?
A quantity-oriented example could be expressed as:
Quantity Service Level = Quantity Fulfilled / Total Quantity Required
An event-oriented approach could instead measure the percentage of demand events completed without a stock shortfall.
These measures answer different business questions. A single shortage involving one piece can count as one failed event even if almost all required material quantity was available. Conversely, one large shortage can have a major quantity impact while representing only one event.
This distinction is especially important for C-parts and industrial consumables. Procurement, production, and suppliers should agree on whether the priority is avoiding shortage events, fulfilling demand quantity, protecting specific critical SKUs, or maintaining another defined availability standard.
Service targets should also be reviewed together with inventory levels. A higher target can require additional inventory or faster replenishment capability. The appropriate balance is company-specific.
Replenishment KPI: Measure the Supplier Response Loop
NVMI connects inventory information with replenishment action. A useful KPI framework should therefore measure what happens after the system detects that material requires attention.
Possible replenishment metrics include:
|
KPI
|
What It Measures
|
|
Signal-to-review time
|
Time between generation of a shortage or replenishment signal and supplier review.
|
|
Signal-to-confirmation time
|
Time until the supplier confirms the intended response.
|
|
Replenishment lead time
|
Time between the defined replenishment trigger and material availability at the agreed location.
|
|
On-time replenishment rate
|
Share of replenishments completed within the agreed operating window.
|
|
Emergency replenishment frequency
|
How often normal replenishment was insufficient and an exception process was required.
|
|
Replenishment quantity variance
|
Difference between the required or agreed quantity and the quantity actually replenished.
|
Not every project needs every metric. The correct replenishment KPI depends on who is responsible for the process and where delays currently occur.
For example, measuring supplier delivery time alone may hide an earlier delay if the replenishment signal remained unreviewed for a long period. A more useful analysis separates signal detection, supplier response, transportation, receiving, and final refill.
Data Quality Should Be Part of NVMI Performance
A dashboard can show excellent inventory metrics and still support poor decisions if the underlying data is incomplete. Data quality should therefore be included in NVMI performance reviews.
Useful controls can include:
-
Percentage of transactions successfully recorded
-
Inventory records without recent updates
-
Physical-versus-digital inventory discrepancy events
-
Unmapped or duplicate material codes
-
Incomplete supplier replenishment records
-
Transactions requiring manual correction
The Bear Bit NVMI architecture records inventory status and material usage information and supports replenishment records and shortage warnings. These data points can provide a more detailed operational history than periodic manual counts alone.
Managers should still verify that the physical process matches the digital process. Real-time data is valuable only when the material location, SKU identification, and transaction logic are correctly configured.
Do Not Average Away Important SKU and Location Problems
A plant-wide KPI can look healthy while individual materials repeatedly fail. For this reason, NVMI reporting should allow segmentation.
Useful dimensions can include:
-
SKU
-
Material category
-
Supplier
-
Plant
-
Warehouse
-
Production line
-
Smart cabinet or bin
-
Criticality class
-
High-frequency versus low-frequency materials
Suppose the overall stockout rate improves, but five critical fasteners continue to create most emergency replenishment events. The correct action may be to adjust those specific material parameters rather than changing the inventory policy for every SKU.
Similarly, average inventory turns can hide slow-moving materials. A high-frequency C-part and a rarely used maintenance spare should not necessarily be expected to achieve the same turnover.
How NVMI Data Supports Continuous KPI Review
The NVMI intelligent material-management approach combines smart inventory equipment with SaaS-based data management. Product documentation describes real-time inventory updates, material usage records, shortage warnings, supplier replenishment information, and visual monitoring of material status.
These functions can support KPI analysis by reducing the delay between physical material movement and digital reporting. For example, inventory consumption can be reviewed without waiting for a manual end-of-period count, and shortage events can be connected more directly with replenishment activity.
For factories evaluating how smart cabinets create these data flows, the smart cabinet industrial material management guide explains how real-time inventory visibility and digital transaction records support ongoing optimization.
Where rapid open access is required for frequently used materials, the open smart cabinet guide provides additional context on digital inventory tracking for high-frequency industrial materials.
Where controlled access and stronger transaction traceability are required, the NVMI-D configuration can be evaluated according to the project's material and authorization requirements. Technical configuration should always be confirmed for the actual deployment.
Build a Balanced NVMI KPI Dashboard
A practical dashboard should avoid presenting dozens of indicators with no clear priority. A balanced starting structure can include one or two KPIs from each major category.
|
Category
|
Example KPI
|
Management Question
|
|
Inventory efficiency
|
Inventory turns
|
How efficiently is stock supporting consumption?
|
|
Availability
|
Stockout rate
|
How frequently is required material unavailable?
|
|
Service
|
Service level
|
How much expected demand can the inventory process satisfy?
|
|
Supplier response
|
Replenishment lead time
|
How quickly is inventory restored after a trigger?
|
|
Exceptions
|
Emergency replenishment frequency
|
How often does the normal process fail?
|
|
Data quality
|
Inventory discrepancy events
|
Can managers trust the digital inventory position?
|
The dashboard should also support trend analysis. One monthly number provides less information than a trend showing whether inventory turns, stockouts, and replenishment response are improving or deteriorating together.
NVMI KPI Implementation Checklist
-
Define the business objective: Identify whether the project prioritizes availability, inventory efficiency, replenishment responsiveness, traceability, or a combination.
-
Document KPI definitions: Specify numerator, denominator, period, location, and exclusions.
-
Create the baseline: Record current performance before changing the inventory process.
-
Confirm data sources: Identify which system provides inventory, usage, shortage, and replenishment data.
-
Segment the analysis: Define which SKUs, categories, suppliers, and locations need separate reporting.
-
Assign KPI owners: Identify who reviews each measure and who is responsible for corrective action.
-
Set review frequency: Match reporting frequency to the speed of material consumption and replenishment.
-
Connect KPIs: Review inventory turns together with stockout and service indicators.
-
Review exceptions: Investigate repeated shortages and emergency replenishment rather than relying only on averages.
-
Revisit targets: Adjust KPI targets when production, suppliers, material criticality, or deployment scope changes.
Image and Diagram Suggestions
-
NVMI KPI dashboard diagram: Show inventory turns, stockout rate, service level, replenishment performance, and data quality in one balanced dashboard. ALT text: "NVMI KPIs dashboard for industrial inventory and replenishment performance."
-
Replenishment timeline: Show shortage signal, supplier review, confirmation, dispatch, receipt, and refill. ALT text: "NVMI replenishment KPI timeline from shortage signal to material refill."
-
Inventory efficiency matrix: Plot inventory turns against stockout rate to show why one KPI should not be optimized alone. ALT text: "Inventory turns and stockout rate comparison for NVMI performance."
-
Service-level diagram: Compare event-based availability with quantity-based fulfillment. ALT text: "Service level measurement methods for industrial NVMI inventory."
Frequently Asked Questions
What Are the Most Important NVMI KPIs?
A practical starting set includes inventory turns, stockout rate, a clearly defined service-level measure, replenishment lead time or response time, and an inventory data-quality indicator. The final KPI set should match the business problem the project is designed to solve.
What Is a Good Inventory Turnover Target?
There is no universal target. Appropriate turnover depends on material type, consumption frequency, supplier lead time, criticality, storage strategy, and required availability. Compare performance with the plant's baseline and with similar material groups rather than applying one target to every SKU.
Should Stockout Rate Be Measured at Plant or Cabinet Level?
Both can be useful. Plant-level reporting shows the broader inventory position, while cabinet or point-of-use reporting can reveal local shortages that plant-wide totals hide. The reporting level should match the replenishment responsibility.
Is Service Level the Same as Stockout Rate?
No. The indicators are related but not identical. Stockout rate measures defined shortage events, while service level measures the ability to satisfy demand according to an agreed event-based or quantity-based definition.
How Should Supplier Replenishment Performance Be Measured?
Measure the stages that matter to the workflow. These can include time from signal to supplier response, time from signal to material availability, on-time refill rate, and emergency replenishment frequency. Definitions should be agreed before supplier performance is compared.
Can NVMI Automatically Provide Every KPI?
NVMI inventory and transaction data can support many operational measures, but the customer still needs to define KPI formulas, reporting scope, business rules, and required data sources. Some KPIs may also require information from ERP, MES, WMS, finance, or supplier systems depending on the project.
References & Sources
-
Bear Bit NVMI product documentation: real-time inventory monitoring, material usage records, shortage warnings, supplier replenishment records, and SaaS-based material data.
-
SAP Help Portal, Inventory Turnovers: quantity-based inventory turnover can be calculated using total usage divided by average stock.
-
SAP Help Portal, Safety Stock Planning: service level can be interpreted using shortfall-event-oriented or shortfall-quantity-oriented approaches depending on the business process.
-
KPI definitions, targets, measurement periods, exclusions, and performance thresholds should be confirmed according to each manufacturer's material-management process.
Conclusion: Measure NVMI as a Balanced Operating System
NVMI KPIs should show whether a manufacturer is improving material availability and replenishment performance without simply increasing inventory. Inventory turns help measure stock efficiency, stockout rate identifies availability failures, service level shows how well demand is fulfilled, and replenishment metrics reveal whether suppliers respond effectively to inventory signals.
No single KPI tells the complete story. The strongest measurement framework connects these indicators and reviews them by SKU, location, supplier, and material category. Real-time inventory and transaction data can then help teams identify whether an exception is caused by consumption changes, replenishment delay, incorrect parameters, or inventory-record problems.
To define an NVMI performance dashboard for your plant, prepare your SKU list, material categories, current inventory workflow, historical consumption, stockout records, supplier replenishment process, user count, access-control requirements, system-integration scope, deployment locations, and target KPIs. These inputs provide the foundation for creating a measurable inventory-management process that can be reviewed and improved over time.